What VR Training Data Tells You That a Quiz Score Cannot

"A training score tells you what someone remembered. It tells you almost nothing about what they would do.
Every organisation measures training. Attendance, completion, assessment score, refresher currency. These get reported monthly, tracked against targets and presented as evidence that the workforce is trained.
They are all measures of the training process. None of them measures competence.
A worker who scores ninety percent on a written LOTO assessment has demonstrated recall of a procedure. Whether they will apply it correctly on a Friday afternoon with production pressure and a supervisor waiting is a separate question that the score does not address.
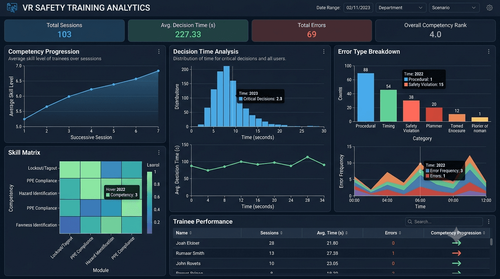
VR is the first training format that produces data about the second question at scale. Whether that data becomes useful depends entirely on deciding what to capture and what to do with it.
Key takeaways
- Completion and score measure training delivery, not competence.
- VR captures decision quality, sequence, timing, attention and error recovery.
- Skill degradation between sessions is measurable, which makes refresher intervals evidence-based.
- Aggregate patterns identify procedure and design problems, not just individual weaknesses.
- Collect fewer metrics deliberately rather than everything the platform can produce.
The metrics worth capturing
VR platforms can record an enormous amount. The discipline is in choosing what to act on.
Decision accuracy. At each decision point, what did the learner choose, and was it correct. This is the closest available proxy for what someone would do on the job, and it is the core of the dataset.
Sequence adherence. Were steps performed in the required order, and which steps were skipped. In safety-critical procedures the order matters, and skipped steps cluster in revealing ways. Verification steps are skipped far more often than action steps, across almost every organisation.
Time to decision. How long between recognising a situation and acting on it. Fast is not automatically good. A very fast response can indicate pattern matching without assessment, and a very slow one indicates uncertainty. Both are worth knowing.
Error type and recovery. Not just whether an error occurred, but what kind, and whether the learner noticed and corrected it. Self-correction is a strong competency signal and is invisible in a written test.
Attention and inspection behaviour. Where the learner looked, what they inspected before acting, and what they walked past. A worker who never looks at the arc flash label before opening a panel has a specific, correctable gap.
Attempts to competency. How many runs before reaching the required standard. This is one of the more useful individual metrics and one of the best leading indicators for role readiness.
Hesitation. Pauses at decision points, often visible as head movement or repeated looking between options. Uncertainty that a learner would never report on a feedback form.
Skill degradation, and what it does to refresher intervals
Most organisations set refresher training intervals by convention. Annual for most things, more frequent for high-risk activities, driven by regulation where regulation specifies it.
Those intervals are rarely based on evidence about how quickly the skill actually degrades, because measuring degradation required re-assessing people, which was impractical.
VR makes it practical. Run a short assessment scenario at three months, six months and twelve months after initial training, and the degradation curve becomes visible for that specific skill in that specific population.
The findings are usually uneven. Some procedures hold up well for a year. Others degrade noticeably within three months, particularly complex sequences performed infrequently. Emergency response decisions tend to degrade fastest of all, because they are almost never practised in normal work.
That evidence lets refresher effort go where it is needed instead of being spread uniformly. It also gives a defensible answer when someone asks why a particular interval was chosen.
Individual data and organisational data are different things
The most valuable analysis is usually not about individuals.
When one operator fails a step, that is a training need. When most operators at a site fail the same step, something else is going on, and the possibilities are worth working through in order.
The procedure may be poorly designed. If a step is consistently performed out of order, the written sequence may not match how the job can actually be done.
The equipment may be the problem. An isolation point that is hard to reach, a label that is hard to read, a control that is ambiguous.
The training itself may be at fault. If a concept is consistently misunderstood, the module explains it badly.
Or local practice may have drifted. Site-to-site variation in the same assessment is one of the clearest signals of informal procedural drift, and it is very difficult to detect any other way.
This is the analysis that produces systemic improvement, and it is only possible when assessment criteria are standardised across sites.
Connecting training data to outcomes
The question leadership eventually asks is whether the training is affecting anything real. Answering it requires linking training data to operational data.
The connections worth building: assessment performance against incident and near-miss involvement, error patterns in training against error patterns in production, time to competency against actual ramp-up on the floor, and training currency against quality deviations.
These relationships take time to establish and should be treated carefully. Correlation across a small population over a short period proves little, and over-claiming here damages credibility with exactly the audience you need.
The honest position is usually that the training data identifies specific weaknesses, that those weaknesses are addressed, and that operational indicators are tracked over a period long enough to mean something. That is a more durable argument than a headline percentage.
Reporting that gets used
Different audiences need different views, and a single dashboard for everyone gets used by no one.
Supervisors need to know who on their shift is due for refresher and who is struggling with what. Actionable, current, at team level.
Training and EHS functions need aggregate patterns, module effectiveness, degradation curves and site comparison.
Senior leadership needs coverage, competency trend, and the connection to safety and operational performance, in a form that fits into an existing management review rather than requiring a new one.
The last point matters. Data that requires a special meeting to look at eventually stops being looked at. Data that appears in the monthly operations review becomes part of how the organisation runs.
Frequently asked questions
How many metrics should we track?
Fewer than the platform offers. Five to eight metrics that drive decisions are more useful than thirty that nobody reviews. Start narrow and add only when there is a specific question to answer.
Should individual performance data be visible to supervisors?
Decide this deliberately and communicate it clearly. Many organisations share currency and completion with supervisors while keeping detailed attempt data within the training function, to preserve the learning value of failure.
Can training data be used in disciplinary processes?
It can be, and doing so usually damages the programme. Once learners believe assessment failures carry consequences beyond retraining, they optimise for the score rather than the learning.
How long before the data is meaningful?
Individual competency data is useful immediately. Aggregate patterns need a reasonable population, typically a few hundred sessions. Degradation curves and outcome correlation need a year or more.
If you want to define a measurement framework before your VR programme starts producing data, EDIIIE can work through it with your EHS and L&D teams."